Data Sources
We obtained sensor reading data from the readings of student labs in EBU-3B (Computer Science) building. The dataset includes readings from 15 rooms across three floors, taken over the course of an entire year from July 2017 to June 2018. The number of datapoints in the dataset varies depending on the number of rooms involved and any missing values.
Data Issues
Firstly and perhaps most importantly, the 15 rooms in this dataset are un-labeled. There is a secondary index that may hint at which room each of the data points belong to. However, when we tried to use these secondary index values as a basis for the rooms, we found that enough of the data points were ambiguous that it was unclear how much room values would actually help with our model. We also asked the owner of the dataset for the room values - they were not kept. Re-obtaining them would also involve using the Brick server that we cannot obtain access to. This means that our model had to handle data that had multiple different energy variables for the same timestamp and other variables.
Another issue with the dataset was that the dataset was designed to have the same amount of data points per room, but was not locked into representing the same window of time. Some rooms’ data cover July 2017-January 2018, while others cover May 2018-January 2019, and other rooms all manner of windows in between. If there was missing data for a room, the time range of data covered by that room was just extended until the number of data points was even. This creates significant missingness in the data that we had to handle.
Finally, the data points were intended to be recorded at regular 5 minute intervals - the data does not match exact 5 minute intervals. The data points range between half a minute to 4 and a half minutes from the timestamp away from the timestamp that represents an even 5 minutes that they were supposed to represent (discounting timestamps that are entirely missing from the data). Predictions are easier with regular windows, so that was an additional challenge for us to tackle.
Data Cleaning
Other than basic transformations to prepare for the modelling, we removed some entries with room codes that did not make sense. Some of the entries seem to be duplicate entries under different codes. Missing periods of readings have been imputed with the last known value. As a result of the issues with the dataset that we ran into, we performed several steps to try and address them before performing the cost transformation:
We separated our data into training and testing sets based on dates in the original dataset, where approximately 70% of the data is before August 1, 2018 and the rest is August 1, 2018 and onwards.
We floored timestamps (with the Pandas Timestamp floor function) in the dataset to the nearest hour. The main goal of this step was to handle the irregularity of the timestamps by ensuring that timestamps were in regular intervals. We also wanted to ensure that there were more data points in each bucket for our next step.
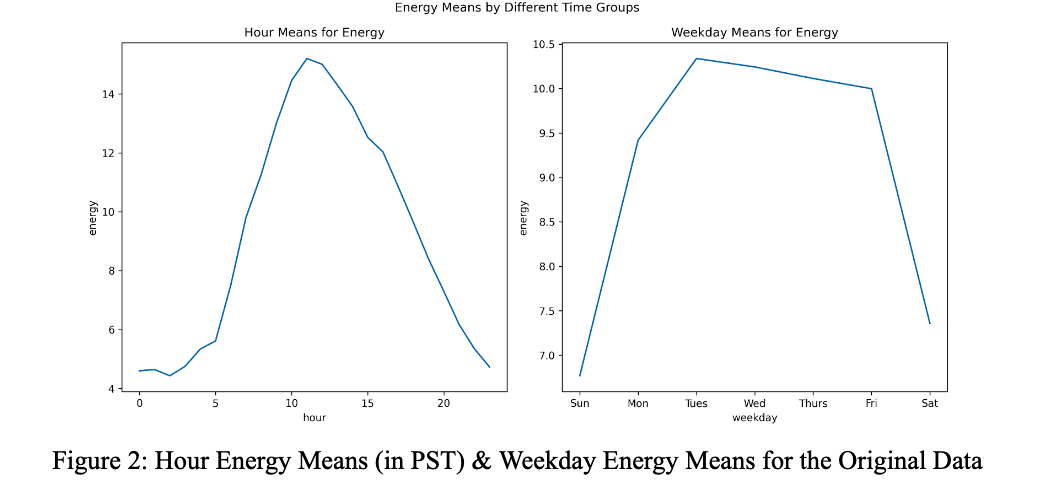
We used medians to aggregate data from each floored timestamp into buckets for the training and testing dataset separately. Since the energy values range a lot as a result of the 15 unidentified rooms in the dataset, medians were chosen over means because they would be less susceptible to unlabeled outlier rooms that use less/more energy. This was a problem in early exploratory work on the dataset - some of the energy values in the 4th floor dataset were significantly higher than the rest of the values in the dataset, indicating that there was likely a very large room that acted differently than standard rooms in the building.
We imputed the training dataset’s missing floored timestamps to have a complete collection of timestamps every hour from July 7, 2017 at 1 pm (UTC) to August 1, 2018 at midnight (UTC). The imputation value was based off of the median value for the hour (ie. if a timestamp was missing on January 1, 2018 at 1:00pm, it was filled with the median energy value for 1:00pm across the whole training dataset). This was chosen because daily patterns for energy were fairly regular. We did not impute the testing dataset to ensure that we did not evaluate our model on predictions of false values.
Finally, we performed the cost transformation described in the Introduction.
![Energy Means]()
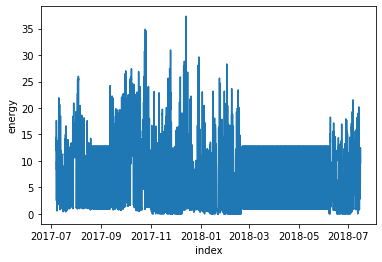
Final Working Data
The energy column post-processing can be seen in the plot below: